Question first
I start with the decision the analysis needs to support, not with a chart or tool.
DATA ANALYST · SQL · POWER BI · PYTHON
I work across business intelligence|
I'm Bhavan Chandupatla, an MSc Data Science graduate from Coventry University. I turn messy datasets into trusted models, useful dashboards and decision-ready insight.
ABOUT / ANALYTICAL MINDSET
My approach is simple: understand the question, make the data trustworthy, analyse what matters, then communicate the answer without hiding behind jargon.
I start with the decision the analysis needs to support, not with a chart or tool.
Validation, reconciliation, nulls, duplicates and definitions matter before any insight does.
I translate technical findings into patterns, risks, opportunities and actions people can understand.
TOOLKIT / CAPABILITIES
Hover over the capability cards — each one represents a part of my end-to-end workflow.
Power BI, Tableau, Excel, KPI reporting, dashboard design, forecasting and data storytelling.
MySQL, PostgreSQL, joins, CTEs, subqueries, window functions, aggregation and troubleshooting.
Pandas, NumPy, data cleaning, exploratory analysis, statistics and machine-learning workflows.
Power Query, dimensional models, relationships, DAX measures, time intelligence and report UX.
FEATURED WORK / CASE STUDIES
Not just screenshots. Each project shows the analytical thinking, technical execution and outcome behind the work.
A relational database investigation where clues are followed across tables using filters, joins and query logic to identify the culprit.
An executive-style reporting solution combining headline KPIs, time trends, product performance and interactive analysis.
My MSc Data Science dissertation at Coventry University: an end-to-end machine-learning project combining employment, education, poverty and self-employment data to identify and predict labour-market patterns.
POWER BI / DASHBOARD
A business-facing dashboard designed to make performance patterns immediately visible without overwhelming the reader.
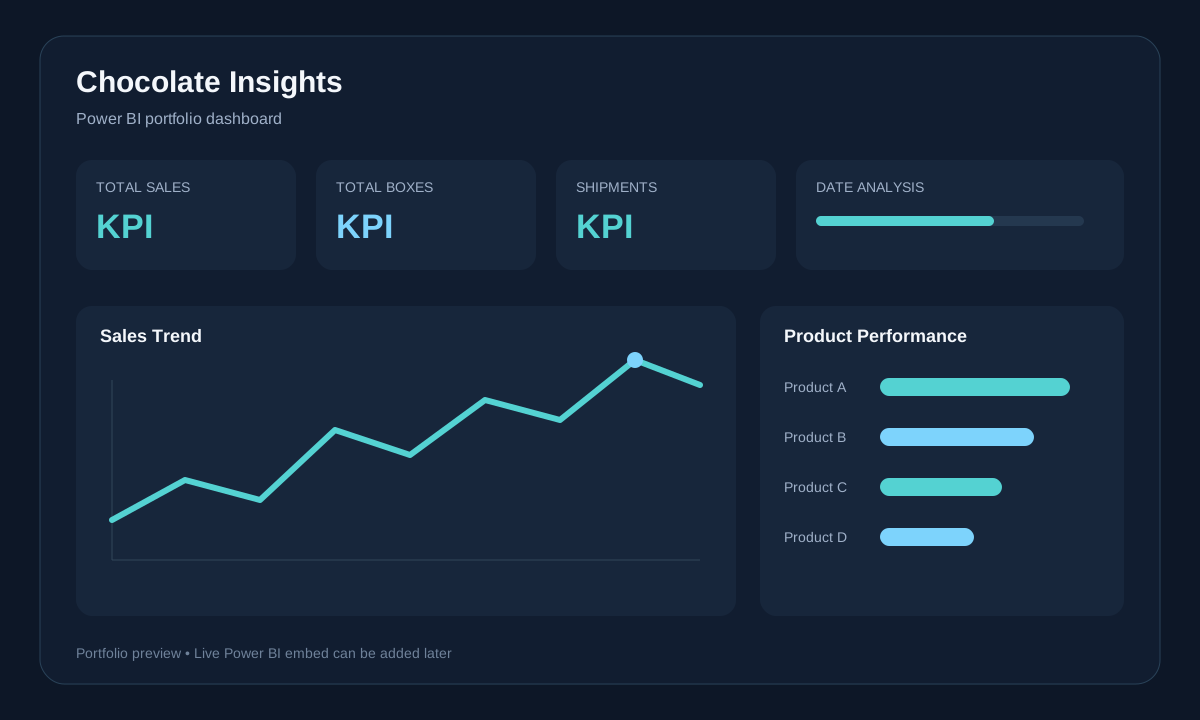
Executive KPI reporting, trends and product analysis built for clear business storytelling.
PROCESS / HOW I WORK
Clarify the question, stakeholder need and decision.
Clean, validate and structure data so it can be trusted.
Use SQL, DAX, Python or Excel to find drivers and exceptions.
Turn results into a clear dashboard, story or recommendation.
LET'S CONNECT
I'm open to Data Analyst and Data Insights Analyst opportunities across the UK.